Demand forecasting is possible if the approximate number of consumers and the approximate consumption rates of goods for each consumer in a certain period of time are known. The estimated need for goods will be equal to the consumption rate of the goods multiplied by the number of consumers. Then, using various methods, the estimated need is adjusted, taking into account the possible influence of the economic situation, seasonality of sales, a possible decrease or increase in the number of consumers, etc. The demand model usually includes the presentation of the average value of demand, as well as the levels of constantly growing, cyclical, slow growing demand, etc. - and random changes in demand near the average value. The data may come from the demand analysis itself, such as past demand, or from external sources, including economic indicators or external estimates. Most short-term forecasts depend on extrapolation of data from the demand process, although seasonal or annual forecasts often use external data to provide explicit values. The application of the smoothing method (selection of the best estimates of the parameters of the demand model), or correction of the model parameters, gives an estimate of the expected level of demand and the expected error, for example, in the form of an average absolute deviation or mathematical expectation. The demand process changes over time, and if the demand model is to reflect the current state of demand, a way must be found to modify the model parameters to reflect these changes.
Short-term projections are for the fiscal year plus quarter. They are used as a basis for planning the need for cash, goods and labor during the year, broken down into semi-annual, quarterly or seasonal. Having developed a sales forecast for all areas of the market, they make an ordering and warehousing program for the whole year in order to be ready for seasonal increases in sales in each area.
Medium-term forecasts cover a period of two to five years and are usually an extrapolation of existing trends into the future, taking into account the impact of expected changes in market conditions. Forecasts are used to establish the timing of the activities that form the sales strategy.
Some manufacturers are trying to predict demand for a more distant future - from 5 to 20 years. The development of such a long-term forecast depends on the company, the life of its products on the market. When it's time to go to market, manufacturers develop marketing plans based on accumulated predictive experience and research.
The forecast based on the analysis of trends and cycles takes into account four factors: long-term growth trends of the firm, cyclical fluctuations in business activity, seasonal changes in sales, and possible irregular events that affect the scale of trade - political events, the emergence of new competitors, technical changes, etc.
Forecasting by the method of correlation analysis is based on statistical data. Identifies trends in the development of the economy that may affect the business activity of the company. Suppose a firm sells automotive parts. An increase in car sales is likely to lead to an increase in the sale of parts. In order to find out how much more spare parts an increased number of car owners will buy, firstly, the degree of correlation between the sales of spare parts and the number of cars sold is determined; secondly, the moment when the increase in the fleet of cars will affect the sales volume of spare parts; thirdly, factors that can influence the ratio between the increase in the fleet of cars and sales volume. Where possible, multiple correlations are identified. For example, dealers in automobiles and spare parts may find a relationship between their sale and the general population's spending on transport. This dependence can be traced by the example of the correlation between changes in sales and changes in each of the other factors over the past period.
The forecast of sales volume as a whole in weight, volume or cost terms is carried out by several methods in order to compare the results obtained and make the necessary corrections. The following methods have become widespread in trade: a forecast based on past turnover, based on an analysis of trends and cycles, and correlation analysis. Forecasting based on past turnover assumes that sales in the planned year will be higher or lower than the previous year's turnover by the expected percentage. Of course, this method is not acceptable when entering the market when there is no past experience. A rough estimate of market capacity is usually made by multiplying the average sales per 1,000 or 1,000 customers by the number of expected Customers. The average sales volume is set on the basis of their own statistics, data from competitors or products! | From the same supplier in the market of another country. It is only important to Determine what proportion of this volume of needs you can Satisfy, and what your competitors will take away from you. You can get more manual indicators only from your own Practice, based on sales statistics.
The specificity of some goods requires a sales forecast for each item in order to determine the timing and volume of their delivery to warehouses to ensure readiness for sale in any period of the year. For this purpose, the problems of demand forecasting for each item are solved using mathematical methods. The problems of long-term forecasting for production planning are discussed in detail in the specialized literature. Current forecasting includes forecasting the magnitude of demand in the interval between two deliveries and evaluating the laws of distribution of demand in this interval, and information about demand and the features of its distribution in the interval between deliveries must be updated, since without special adjustment it turns out to be insufficient. As the experience of large suppliers has shown, mathematical methods for forecasting demand and calculating stocks are equally useful in wholesale and retail trade.
The mathematical approach to forecasting consumer demand consists in dividing it into its main constituent elements, among which stand out: the development of demand as the main trend, seasonal fluctuations in demand and its random fluctuations, for which they use the tool of mathematical statistics. Often in practice, demand forecasting is carried out only on the basis of average values. To simplify calculations, some companies often make short-term forecasts based on demand values that are average at best and do not take into account the element of uncertainty. Forecasting is performed depending on the needs, using the exponential equalization method.
Such forecasts are usually overly optimistic, do not take into account the element of uncertainty and lead to significant fluctuations in reserves. More realistic is such forecasting, in which, along with the average value (mathematical expectation), the possible error. In this regard, the tasks of improving forecasts and inventory management strategies are solved, taking into account errors in demand forecasting.
Renault, for example, when preparing short-term demand forecasts, determines the current stock of necessary
details in the distribution and marketing network as the average value of the expected demand, by graphical extrapolation of past demand data, and the safety stock as a value proportional to the typical deviation of the demand distribution law in a given period, taking into account the existing trends in demand fluctuations.
The company has established as a result of research that the distribution of demand in a given interval follows:
These patterns make it easier to calculate the safety stock. According to the formulas corresponding to these laws, a typical deviation is calculated, which, when multiplied by the service factor set by the company's management (the level of demand satisfaction), gives the value of the safety stock.
In long-term forecasts, in addition to the parameters characterizing the expected demand and its distribution in the intervals between deliveries, as well as the parameters characterizing the deviation of the delivery intervals, changes in demand are taken into account depending on the service life of the machines, the correlation of the expected sales volumes and the quantities of new machines planned for production, etc. parameters.
Any forecast obtained as a result of the application of mathematical methods with the help of computers requires mandatory adjustment using data that can not be taken into account when based on past demand and factors that cannot be programmed. Such data includes social and political events, climatic and economic market conditions, etc. Forecasts are adjusted by sales specialists who know market conditions.
When forecasting the demand for goods, the following factors should be taken into account. Forecast horizon - reporting periods, the demand of which must be taken into account when forming the next Replenishment Order. Waiting time for replenishment and frequency of Orders when determining the forecast horizon. Take into account the appropriate forecast horizon in the formula using Past Demand. With a distant forecast horizon, assign specific weights to demand indicators recorded in the corresponding and subsequent reporting periods of the previous year. Past sales figures are often a good indicator of future sales. Use a weighted average of past demand to calculate future demand. Assign weights to the previous months the same as the previous six months, or gradually decrease the weights for the past few months.
Take into account last year's demand indicators for the reporting periods corresponding to the upcoming ones: use different weight systems for goods of seasonal and non-seasonal demand; use different weighting systems for products with different consumption dynamics.
If goods from the warehouse are delivered to other departments, the demand of the receiving departments should be accumulated for it.
Analyze past demand indicators in order to identify typical ones: demand for the just ended reporting period exceeds X times (for example, 3 times) the forecast; demand for the period just ended is Y% (for example, 20%) less than the forecast.
Trend control - sales changes caused by economic changes, changing consumer preferences or seasonal factors. Determine trends in changes in sales indicators over the past few months (in units, not in monetary terms). Calculate trend coefficients for a product or for a product group for each warehouse. You should not calculate trend coefficients for a warehouse or an entire company. Even if sales as a whole increased by 10%, for some product groups it could increase by 30%, while for others it could decrease by 40%. Set whether to allow sales staff to calculate trend ratios and make adjustments in the event that transactions are expected to increase/decrease.
It should regulate the definition of expected changes in consumption not reflected in past indicators: establish who should make expert judgments (ie, sales staff or customers); determine how to take into account these estimates in the forecast and in procurement; establish how to track the accuracy of these estimates; Decide whether to reward buyers and/or sales staff for providing accurate forecasts.
Demand forecasting is the definition of possible future demand for goods and services in order to better adapt business entities and the emerging market conditions. Demand forecast is a theoretically substantiated system of indicators about the still unknown volume and structure of demand. Forecasting connects the experience accumulated in the past about the volume and structure of demand with the prediction of their future state.
The forecast of demand is considered as a forecast of the physical volume of the sale of goods (services). It can be differentiated by categories of consumers and regions. Forecasting can be carried out for any lead time. The main emphasis in the short-term forecast is on quantitative, qualitative and price assessments of changes in the volume and structure of demand; time and random factors are taken into account. Long-term forecasts of demand determine, first of all, the possible physical volume of the sale of goods (services) and the dynamics of price changes.
When setting demand forecasting tasks, it must be borne in mind that they are solved as the main patterns and trends in the development of demand in the past, present and subject to conservation in a certain future are identified. Therefore, it is important to correctly select and justify the period for analyzing the process of studying the formation of demand.
The process of forming the demand of the population, as already noted, is a complex economic phenomenon. In trading enterprises, the process of circulation of goods is completed, by purchasing certain goods, buyers satisfy their needs. In the focus of a commercial enterprise, the impact of the entire mass of factors of effective demand is realized. However, when studying the behavior of a particular consumer, it is difficult to separate the impact of each of the socio-economic factors, identify their features at the level of a commercial enterprise, and quantify their impact. At the same time, at this level of control overall impact on the formation and development of demand factors of an economic nature, the organization of the trading process and the supply of goods, advertising, and consumer behavior have a significant impact on the final results of the sale of goods. In addition, it is difficult to obtain initial data on the complex of factors that form demand in the area of the enterprise. Therefore, as a rule, trading enterprises have and are forced to operate with data on the sale of goods that more or less representatively reflect the process of meeting demand. They can also be used to study the process of formation of demand of the buyers of the area of activity, both in the intra-group and in the detailed assortment. The expected demand can be represented as the following components:
where Рп - realized demand;
Sc - unsatisfied demand
But this formula does not reflect the influence of such factors as seasonal (periodic) and random fluctuations in demand caused by such objective reasons as the gap between production and consumption or the seasonal nature of demand for certain goods. For example, the demand for winter shoes increases significantly in autumn period and falls into summer. Therefore, seasonal fluctuations are necessarily taken into account and superimposed on the development trends of micro-demand.
The influence of random factors of demand fluctuations caused by unpredictable changes in the economic situation in the economy as a whole or natural disasters, it is almost impossible to predict, therefore, it should be taken into account that the distribution area of possible actual demand values will be in a certain interval (and not necessarily coincide with the forecast), which guarantees a certain probability of the forecast.
Analysis and forecasting of demand development trends are objects of using economic forecasting methods. However, it is necessary to choose a forecasting method taking into account the specifics of demand formation, depending on the specific goals of forecasting and the level of trade and services management.
Demand forecasting can be carried out by various methods, in particular, three main groups can be distinguished:
1. methods of economic and mathematical modeling (extropolation methods)
2. normative methods
3. methods of expert assessments.
Demand forecasting is necessary for the government to control the private sector, to improve the efficiency of the tax administration, and to encourage or attempt to limit this forecast demand. It must be said that here we will talk about the market (aggregate) demand, which is "expressed in such a quantity of goods that will be bought by a certain group of buyers in a certain region in a certain period at certain trading enterprises" "(F. Kotler Marketing Management M. : "Economics", 1980, p. 84). Market demand can be expressed in physical, cost or relative terms. The forecast of market demand is made for a certain period, the longer this period, the more difficult it is to make a forecast.
Market (aggregate) demand is influenced by a huge number of factors: economic, socio-cultural, demographic, technological and many others. All these factors must be taken into account when forecasting. It should also be noted that consumption depends on the level of demand, and it is affected by the same factors as demand. The ultimate goal of demand forecasting is to estimate the quantity of goods and services that will be purchased (and not just that which consumers can and want to purchase).
Consumption makes up a significant part of the state's GDP, so ""fluctuations in consumption are the most important elements of ups and downs in the economy""3. Changes in consumption can amplify the impact of economic shocks, and the value of the fiscal policy multiplier is determined by the marginal propensity to consume. The consumption function states that consumption depends on disposable income:
Disposable income is equal to total income (Y) less taxes (T). The total income, in turn, may consist of wages, income on shares of enterprises, any additional cash receipts, and this should also include various benefits, social benefits, etc. At the first stage of the Study, we will assume that all income goes to consumption.
The formula shows that the state can influence consumption by raising or lowering income tax rates. Based on the current level of total income, the state can predict the level of demand depending on the income tax rates, all other things being equal (ie, without the influence of c.-l. other factors).
That is, the predicted level of demand is equal to a function of the level of income tax. The higher the percentage rate of the tax, the less a person will consume, the less will be the projected demand.
The next stage of the study should consider the impact of the price level on goods and services. Obviously, the price level has a strong influence on consumption and the level of demand for goods and services. An increase in the price level has about the same effect as a decrease in the level of disposable income, i.e. There is an inverse relationship between the price level and the level of demand. Accordingly, a new variable P appears in our formula - the price level.
The forecast level of demand is a function of interest rate income tax and price level.
It is curious that R. Barr considered pricing in the Soviet economy one of the most important components of planning. He wrote: The Soviet price system can only be understood in the light of economic planning; it serves simultaneously to promote the development of the economy and to regulate supply and demand for consumer goods. (Raymond Barr Political Economy, M., International Relations, 1995, Vol. 1, p. 601) In the case of an excess of supply, lowering prices allows increasing the purchasing power of the population; otherwise, demand will keep prices down. However, in a market economy, the government cannot raise or lower prices directly. For this, indirect methods are used: raising or lowering taxes (on enterprises, on certain types of goods and services, on household incomes), increasing or decreasing social benefits and payments, creating benefits, etc.
Let's consider these indicators in relation to demand forecasting. The taxes that the state imposes on enterprises directly affect the price level, and through it, demand and consumption. However, usually prices rise not by the entire amount of the tax, but by some part of it; also, when forecasting, it is necessary to take into account the fact that a certain time passes from the moment the tax is increased (lowered) and the corresponding decrease (increase) in demand. Taxes on certain goods and services, as well as turnover taxes, have the same effect on prices and then on demand. In Soviet times, the last rate was 88% for vodka, 40% for caviar and cigarettes, 25% for radios, and 2% for cars.
The next categories to consider are social payments and benefits, as well as various benefits. Increasing the level of social security increases the purchasing power of certain segments of the population and lowers the purchasing power of others (because the money for the payment of benefits is taken from taxes, respectively, or taxes increase or other areas of public funding suffer). Thus, our formula has acquired the following form:
PUS \u003d f (T, f (Z, Tpr, Prib), CO)
where f(Z,Tpr,Prib) = P, i.e. the price level is a function of the level of costs, of taxes on the enterprise and of profits.
SO - social security.
A lot of research is devoted to the consideration of demand side regulation. One of the historical precedents of demand management is of extreme interest from the point of view of the development of macroeconomic theory. In the period leading up to the First World War, the economies of the industrialized countries functioned under the gold monetary standard. However, during the war, many countries were forced to abandon it, as they had to print money to pay for the costs caused by the war. However, in 1925 Great Britain decided to return to it. To do this, the government pursued a tight restrictive monetary policy, at the same time revaluing the pound sterling, as a result of which its dollar value rose by 10% (J. D. Sachs, F. Larren B. op. cit., pp. 93-95). These actions caused a sharp drop in aggregate demand. And the result of the fall in aggregate demand was a sharp drop in production and rising unemployment. This policy was criticized by Keynes. The British government built its forecasts regarding aggregate supply and demand, based on the classical theory, according to which, due to a fall in demand and, accordingly, a fall in prices (which Churchill's policy led to), nominal wages would have to be reduced by a sufficient amount (prices would have fallen, wages would also fall by the same amount, thereby avoiding a fall in output and an increase in unemployment). Keynes argued that this could not be. Workers will not agree to a reduction in wages, but will agree to this only in the event of a sharp increase in unemployment.
The economic factors of demand forecasting have been presented above. However, one should not be limited only to them when forecasting aggregate demand.
It is also necessary to take into account political factors, both domestic and foreign. If the political situation in a country is tense, then the inhabitants of this country have doubts about the future. As a result of this, it is highly likely that the demand of the population will be overestimated, because. residents will try to buy goods in reserve. Accordingly, knowing this, the state must regulate this increased demand - by raising prices, increasing taxes, etc. However, this cannot be dealt with by economic measures alone - a calming campaign should be carried out in the media, the acute situation itself should be resolved as quickly as possible.
The next important factor is the international environment. Perhaps this factor does not affect the demand of the population for ordinary goods and services too much, but it does affect the demand for such specific goods as military equipment. This does not mean that the population tends to buy "black sharks", "acacias", "MiGs" - this means that the population makes demand for these "goods" to the state.
Geographical features strongly influence the structure of demand. Indeed, it is difficult to imagine that warm clothes will be in demand in Australia, while in Russia the demand for them will be great. Geographical conditions must be taken into account not only when forecasting demand, but also in the production of goods (its design features d.b. different for each individual country). For example, almost all automotive concerns supply cars to Russia adapted to Russian conditions. .
Journal: PharmOboz.
Continuing the theme of "Inventory Management", which was started in the last issue, I would like to remind you that the meaning of the existence of any commercial structure is to make a profit. The only question is, thanks to what the company provides itself with a profit? One of the most common points of view is that the success, in particular of a pharmacy, depends on the level of prices, the level of service, the location of the pharmacy, and so on and so forth. All this is true, but it is worth starting from another. Pharmacy's profit is provided by its CLIENTS. They are the ones doing the shopping at the pharmacy. Or they don't! But the task of employees is to retain and increase the customers of the pharmacy. This can be done by maintaining the service level at a very high level. The level of service depends on how polite the sellers are, on the level of prices in this pharmacy, how many cash registers are in the hall, on the possibility of providing medicines on order, and on the range that we offer to our customers. Do we have the drugs that our customers need in stock? How often do we have a shortage in one or another item in our pharmacy?
And since the pharmaceutical wholesalers quickly replenish the stocks of the pharmacy, it is important here to determine the need for the product in time and not miss the moment of ordering the wholesaler in order to prevent a shortage. With such large assortment, which is supported by pharmacies, it is simply impossible to keep all positions in memory, which is why it is necessary, using modern software products, to ensure that the need for medicines ah on a higher level.
How does the process of determining the need for a particular position in a pharmacy usually take place? Customers ask, so you need to order. The drug is over, it is time to submit an application to the supplier. But this approach works when the sellers themselves are interested in increasing sales. Unfortunately, such a developed system of motivating pharmacy staff is extremely rare.
Let's imagine the most common situation. A potential client comes to the pharmacy, stands in line, asks a question about the availability of the medicine that the doctor prescribed for him, but this medicine is not available. A person leaves the pharmacy without a purchase, and even upset by the lost time. Accordingly, the need is not satisfied. Did the pharmacy employee (pharmacist) record this need? It is unlikely, since he has a queue, and, therefore, he has no time to be distracted by additional operations. Bottom line: the client left without a purchase - the pharmacy has lost profits. And it is difficult to say whether this client will come to the pharmacy or not.
Another example. Let's assume assortment at a drugstore of 5000 positions. It's time to place orders with suppliers. Can the pharmacist accurately determine the required lot size for each item? Probably not. We go through the list of goods, suppose in alphabetical order. Already after 20 minutes of such work, the vigilance and attentiveness of the pharmacist is dulled, there is not enough time, or the financial limit of the order has been exhausted. As a result, those positions that we have at the end of the alphabetical list are left without attention. What is the result? A deficit is formed, and, consequently, lost sales and profits.
And finally, the third example. At the stage of choosing a supplier and establishing relations with him, a certain negotiation issue is held, where, among other things, the supplier should be concerned about the volume of supplies for your pharmacy. The price level that the supplier will provide you will depend on the volume of deliveries. In addition, the supplier himself will plan the volume of supplies from manufacturers of medicines and medicines. What data can a pharmacy provide to a supplier about supply volumes if there is no forecasting system? Only data on sales volumes in the previous period. But no one knows how much they correspond to the actual demand.
That is why it is advisable to use demand forecasting systems, which, taking into account the demand in past periods, generate data on possible demand in the following periods.
So what is forecasting? A forecast is an assumption about the future. Of course, we cannot provide an absolutely accurate forecast. In addition, the shorter the forecast horizon, the more accurate the forecast can be. But the absence of forecasting systems in the company does not facilitate or improve the situation, but, on the contrary, makes the system uncontrollable and opaque.
The article discusses fairly simple and affordable forecasting methods. This is due to the fact that a significant complication of the methods does not lead to a significant improvement in the quality of the forecast.
Below is a basic calculation formula for the forecast, which is worth starting from, adding the subtleties and individuality of the products that pharmacies work with.
Рt is the forecast of demand for the period t;
Bt is the value of basic demand in period t;
Ct is the coefficient of seasonal fluctuations in period t;
T is the coefficient of the temporal trend: increase or decrease in demand for the period t;
Mt is the coefficient of adjustments for sales promotion in period t (marketing component;
Let's look at all the components in order.
The value of the underlying demand is the average value of demand for the past period.
The seasonal factor must be calculated for products that have a seasonal character. To do this, you need to analyze consumption for 3 years. It is possible to collect data for more years, but here there is a possibility of influence on the product of factors that are already outdated. Seasonality analysis for less than 3 years may not be accurate due to the randomness of events.
So, how to determine the Seasonal Variation Factor?
The calculation is presented in table 1 and formulas.
Table 1 - Definition of the seasonality index
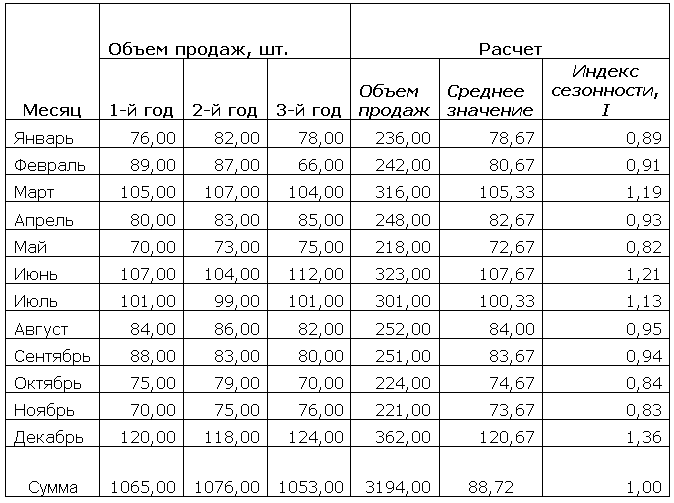
3. adjustment factor for sales promotion. This coefficient is set by the marketing department, based on its own experience, since it is not subject to calculation.
In addition to the basic demand forecasting model, there is a large number of statistical methods. We list some of them:
Finding the arithmetic mean. This technique is acceptable for goods of high stability, without a seasonal component, in the absence of a temporal trend. It is impractical to use, since such products practically do not exist.
Determination of the forecast value using the moving average method. Applies also to stable goods.
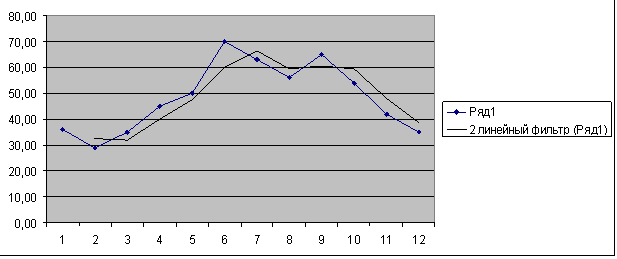
Linear forecast. It works by finding the dependence of the sales volume of the future period on the base one, using a linear function. Figure 1 graphically presents the forecast for the thirteenth period using a moving average and a linear function.
Figure 1 - An example of a forecast for a stable product

The blue line on the chart is the actual demand, the purple line is the forecast using a moving average, and the black line is the linear forecast. The question is which of these predictions is more accurate. The moving average chart on the historical chart is constantly next to the actual value. And the linear forecast chart shows an upward trend. It will be more accurate in this case.
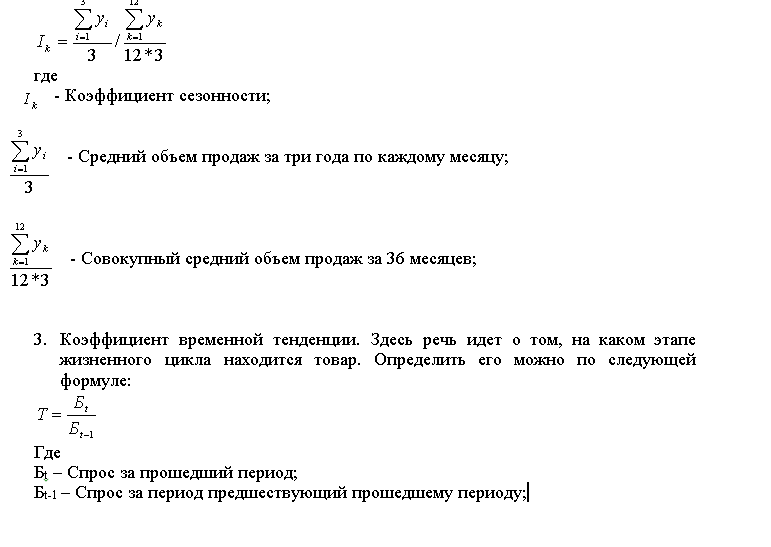
Exponential smoothing. It is used for unstable goods, in connection with this, the accuracy of the forecast will be low. Examples in figures 2, 3, 4.
Figure 2 - An example of a forecast for an unstable product (power function).
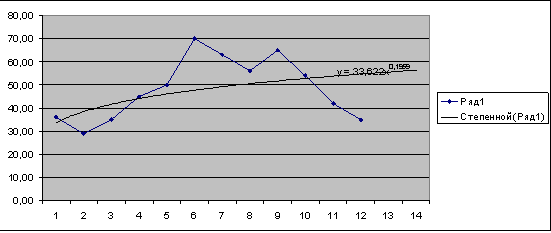
Figure 3 - An example of a forecast for an unstable product (polynomial)
Figure 4 - An example of a forecast for an unstable product
Based on figures 2, 3 and 4, you can see how different results we get on the same input data using different functions. Therefore, for unstable goods, it is especially important to carefully choose forecasting methods to improve forecasting accuracy.
At the same time, it should be noted that those companies that have already implemented and are actively using statistical forecasting methods face a number of problems.
First, the systems in place are often inadequate. That is, they do not correspond to the behavior of the goods. When automating this process, the purchasing manager relies on the data that the Information system without thinking about how accurate these data are. And the manager himself is often not aware of how the forecast data is formed.
Suppose we have information about the movement of the Spazmalgon product for 2 months (Table 2).

Table 2 shows that in two months there were a large number of days when Spazmalgon was not on the pharmacy shelf. If the forecast for September is built on the basis of sales for the months of July and September, using the arithmetic average, we will get the following data (the arithmetic average is used here as an example, the forecasting method must be selected individually for each product group; in addition, to apply this method, data are needed as for at least three months):

With this approach, we do not take into account the days when the goods were not in stock. In fact, this is a shortage, that is, there was demand, but the pharmacy could not satisfy it. And, consequently, there were lost profits.
If we use the same methodology, but rely on demand, we can get more accurate demand data. How to do it? There are two options here:
Each time a customer contacts a seller with a question about a product that is out of stock, enter information about it in a special document, not forgetting to register the volume that the customer needs. But in retail, this approach is unacceptable, since it greatly increases the customer service time, and, consequently, the level of service drops.
Another option is to determine the demand, taking into account only the days when the goods were in stock. Real sales data in our example are presented in Table 3.
Table 3 - Definition of real demand
At the same time, it is necessary to strive to reduce the forecasting error. In addition, it should be based on it when choosing a forecasting system. Considering various options for forecasts (including empirical ones, that is, built on personal experience), choose the method that will provide the minimum forecasting error.
But still, statistical forecasting methods have several limitations:
- When opening a new pharmacy, it is impossible to absolutely accurately determine the volume of sales in it;
- Accurate forecasting requires data for 3 periods (year, month, week)
- When a new product is introduced, no one knows what the real demand for it is.
But, as for the current operational work with stocks, this is one of the most important tools that further simplifies and improves our work qualitatively.
Of course, the very process of introducing and adapting a forecasting system is very complex and lengthy. But, as a result, at the output we get:
Automation and acceleration of the decision-making process on the volume of supplies;
Reducing the deficit due to closer attention to each position of the pharmacy assortment portfolio;
- Decreased inventory;
- Increase in sales;
- Planning work with suppliers;
- Receipt best offers from the supplier due to the stability of relations;
- Better use of the pharmacy's financial resources;
- Increasing inventory turnover.
Modeling and forecasting the demand of the population for goods and services
Scientific forecasting of demand is necessary for developing a long-term economic policy and making tactical management decisions in the field of production and trade in consumer goods.
Demand must be predicted at all levels of economic management.
At the macro level, based on forecasts of demand for consumer goods, a mechanism of state influence on the consumer market is being developed in order to ensure a balance between supply and demand and to fully meet the needs of the population in goods both in the current period and in the future. Similar problems are solved at the regional level.
At the micro level, demand forecasts are developed by both trade organizations and consumer enterprises and manufacturers.
Trade organizations in the conditions of market relations may demand from manufacturing enterprises the supply of goods needed by the population.
Based on the results of predictive calculations of demand, manufacturing enterprises conclude contracts for the supply of products and form a production program.
Long-, medium- and short-term demand forecasts are developed. Differences in the goals of certain types of forecasts of the time aspect give each of them specific features. Thus, short-term forecasts are implemented within the framework of the already established structure of demand and production capabilities. The results of forecasts are used to justify orders and applications for consumer goods, to calculate commodity supply retail trade and for making managerial commercial decisions. Short-term forecasts are developed for a month, a quarter, a year. They should have a higher degree of accuracy. In short-term forecasting, a fairly wide range of indicators is determined (aggregate demand, demand for groups of goods, assortment structure, etc.).
When developing medium-term forecasts, the existing structure, production opportunities and the impact of investments on the development of production activities are taken into account. Within three to five years, the range of goods in the country is significantly updated and the structure of demand changes markedly. Under these conditions, there is no need to detail the demand forecast to models and brands of goods. It is enough to determine the aggregate demand with the allocation of the main product groups.
Long-term forecasts (over five years) serve as a means of developing a strategy for the production of goods and trade. A feature of long-term demand forecasting is that it does not necessitate linking forecast estimates with the emerging structure of production. The long-term forecast of demand serves as the basis for the development of promising directions for the development of the production of goods and trade.
Forecasts different in terms of lead time also differ in the methods of forecasting.
To improve the accuracy of forecasts, it is necessary to apply a set of forecasting methods in order to obtain several forecast options and select the optimal option.
Demand acts as a determining factor in making decisions about the production or import of a particular type of product, so it should be studied both within the country by region and on the world market.
The demand forecasting process includes a number of steps:
Comprehensive study of the market, competitive environment, allocation of market segments;
Analysis of the state of supply and demand, determining the degree of satisfaction of the demand of the population in specific goods, aggregate demand; analysis of factors influencing demand and establishing the interdependence of indicators;
Choice of forecasting methods;
Implementation of demand forecast;
Evaluation of forecast reliability;
Determining the prospects for the development of demand of the population;
Development of specific measures to better meet the demand of the population.
Forecasting effective demand is based on the statistics of the retrospective period and on the forecast of a number of factors that determine demand.
To carry out forecast calculations, the following initial information is required:
Information about the population, age and sex composition in the forecast period, the number of urban and rural residents;
Dynamics of supply and demand;
Data on the development of agricultural production and the production of consumer goods;
Balances of cash income and expenditures of the population;
Distribution of the population by income;
Budgets of families of workers, employees, collective farmers;
Special one-time sample data
inventory surveys of non-durables
the population, income and expenditure;
Information about consumer price indices (general and individual - for specific goods), the ratio of domestic and world prices;
Survey data of buyers in order to identify their desire to purchase certain goods;
Changes in monetary incomes of the population in previous and forecast periods;
The share of household spending on food, non-food products, certain groups of goods in previous periods.
At the initial stage of forecasting, demand trends are identified.
To analyze trends in demand, it is advisable to use graphs and various kinds of charts and cartograms.
Based on the identified trends, it is advisable to determine the demand for the short-term period using extrapolation methods: the method of selecting a function, exponential smoothing with an adjustable trend, etc.
In the case of a stable trend in demand, forecast calculations can be made by leveling the time series and selecting the function (at= at + b- linear, at= at 2 + bt+ from- parabolic, etc.).
Under changing conditions, it is advisable to apply the method of exponential smoothing with an adjustable trend. The development of demand is subject to seasonal fluctuations, which must be taken into account in short-term forecasts for a quarter or a month. Accounting for the influence of seasonal fluctuations in sales (demand) is advisable to carry out using the estimated seasonality indices.
In practice, to study demand, observations, surveys of buyers about purchasing intentions (questionnaire surveys, interviews), fairs, exhibitions, offer books, testing, and advertising are widely used.
At the macro level, the most widely used for demand forecasting is normative method involving the use of norms for the consumption of products (goods) per capita. In this case, depending on the forecast period, it is necessary to apply the following approaches.
When determining demand for the long term, it is advisable to use the recommended (rational) consumption rates. For example, the rational rate of consumption of meat and meat products per capita is 82 kg per year. Based on this norm and the population in the country (region), the need for meat and meat products for the forecast period is calculated. Needs act as a guideline for the development of production and the development of measures in order to achieve rational consumption standards.
Short-term forecasts of demand should be built taking into account the adjustment of consumption rates. To do this, actual consumption per capita is analyzed by period and compared with recommended norms. Trends in product consumption, the rate of decline or increase in demand, and the reasons for its change are identified.
Then, taking into account the influence of factors, primarily changes in household incomes and consumer prices, real consumption per capita in the forecast period is determined.
Demand forecasts for the most important goods are developed to analyze and forecast the state of commodity markets and develop recommendations on measures of state influence on these markets, as well as provide interested organizations with information on demand dynamics.
In a market economy, the demand for consumer goods is formed under the influence of a number of factors, therefore, for forecasting calculations, it is recommended to use multi-factor models - linear or non-linear:
y 1= but1 x1t+ a 2 x 2t+ ...+ butnXnt+b;
y 1= bx 1 t a1* x2 t a2 *…..* x n t an
where at- an indicator of demand for goods; x 1 , x 2 , …х n: - factors influencing demand.
With the help of correlation-regression analysis, a relationship is established between demand and factors, its form (linear, non-linear) and the tightness of the relationship are determined.
It is advisable to develop several options for forecasting the demand for consumer goods, differing in the values of the factors that determine them. Comparison of various options allows you to choose the one that provides the most complete satisfaction of the needs of the population in individual goods.
Demand forecasting can be carried out on the basis of one-factor models. It is advisable to use them when it is necessary to take into account the influence the most important factor on demand. For example, with a stable price level, it is possible to determine the dependence of demand for goods on changes in the income of the population.
The demand for consumer goods can be determined using the elasticity coefficient.
The economic meaning of the elasticity coefficient is that it is an indicator that characterizes the degree of change (increase or decrease) in demand for 1% change (increase or decrease) in the factor. Demand is formed mainly under the influence of changes in income and prices. K e shows how demand changes as a percentage when these factors change.
In the transition period, when the differentiation of household incomes increases, it is advisable to use a regression model built on the basis of data on the differentiation of household incomes and expenditures by commodity groups to predict demand, the essence of which is as follows. The population, in accordance with income per person, is divided into percentile (decile) groups, i.e. allocate the 10% of the population with the lowest income, then the next 10%, and so on, ending with the distribution by a group consisting of the 10% of the population with the highest income. Population incomes are considered as the only factor in the formation of a promising structure of demand. Data on incomes of the population and expenditures by commodity groups are formed in the form of a table. It reflects population groups by income, income interval per person per year (month), percentage of the population by income intervals, average income per person, expenditures by commodity groups per person per year (month).
The forecast of demand for each commodity group will be formed under the influence of changes in income per capita.
To predict the demand for goods, you can use a model of consumer behavior in terms of commodity-money relations, based on the principles of optimal satisfaction of needs by consumer groups. The model looks like:
∑ Y j → max;
∑ P j Y j ≤ D;
Qj≤ Yj ≤ Qj
where Yj - demand j-th item; Pj - price for the j-th product; D- consumers' income; Qj, Qj- the lower and upper limits of the demand for the j-th product, taking into account the supply.
Consumers are preliminarily divided into homogeneous groups according to socio-demographic characteristics. It is believed that within each group preferences for a set of goods and services are the same.
When forecasting demand, taking into account the characteristics of goods, various approaches can be used. Yes, for goods light industry demand is determined in terms of their wide range. It is difficult to develop a forecast for such a wide range of positions, so individual positions must be aggregated. For example, in the group of garments, fashionable clothes, work clothes and other subgroups can be distinguished. You should also take into account the terms of wear and tear of products and wardrobe renewal, divide goods into groups based on the gender and age characteristics of consumers (for example, goods for young people, children, the elderly).
Demand forecasts for cultural and household goods should be based on the number of families, their provision with these goods, buyer intentions to purchase, the availability of cash savings, housing conditions, etc.
The total demand for durable goods consists of two parts: the demand for replacement and the demand for the expansion of the fleet of these products. The demand for replacements can be determined based on the sales of these products in previous years and the average duration of their use in families. According to statistics, the average service life of televisions, electric vacuum cleaners, watches of all kinds, tape recorders is 10 years, refrigerators - 20, washing machines- 15 years.
The forecast of demand for specific types of goods should be carried out taking into account data on changes in the share of individual goods in the total volume of trade.
Based on forecast calculations of demand, the structure of effective demand of the population is determined and a consolidated trade order is developed for the production of the most important consumer goods for the planned period.
The forecast of the demand of manufacturing enterprises for manufactured products assumes:
Analysis of trends in the company's share in the overall market;
Assessment of the market strategy of competitors and prospects for the development of new types of products;
Analysis of the company's market strategy and product quality;
Forecast of demand for the company's products.
For the company, the main thing is to gain consumer confidence in its products. In order to predict the future needs of people, it is necessary to analyze how the consumer reacts to the appearance on the market of fundamentally new products.
Foreign researchers distinguish among the possible following areas of the company's strategy for the production of products:
External difference goods in the eyes of the buyer from the goods of competitors;
Entering the market with a new product;
Developing a pioneering product that will lead in the coming years, providing superiority over competitors.
To implement these areas, ideas are collected to create a new product and the time between the presentation of ideas and the trial sale of the product is reduced to a minimum. In order to search for ideas, methods of expert assessments are widely used: the method of collective generation of ideas, the "635" method, the "Delphi" method.
Japan is the leader in the development of the firm's strategy. Japanese firms take pride in the fact that their employees annually contribute a huge number of ideas, from which 7 to 10 original ones of practical importance are selected.
Before making a decision on the release of new products, along with a demand forecast, it is necessary to predict production costs, price and profit.
To identify the reaction of consumers, it is advisable to use advertising, trial sale. The study of demand for new products can also be carried out at sales exhibitions, exhibitions, viewings, fairs. The degree of compliance of products with the needs of buyers, their preferences for other analogous goods and the conditions under which the population prefers new goods (price, design, etc.) are determined.
Market novelty products are key to the commercial success of an enterprise. Firms producing such goods are able to set monopoly prices and earn higher profits.
Each product has its own life cycle(JCT). The concept of LC is based on the fact that the product has a certain period of market stability. The life cycle or the curve that describes it in terms of "profit-time" can be divided into the stages of implementation, growth, maturity, saturation and decline. The transition from stage to stage occurs without sharp jumps, and therefore it is necessary to monitor changes in the rate of sale or profit in order to catch the boundaries of the stages and make changes to the product or production program.
In predictive research of the commodity market, along with a comprehensive analysis, the developed pricing strategy plays an important role, since the price is an important lever for promoting goods on the market and a determining factor in sales and profits.
Concept and types
In other words, this is a forecast of future sales, determining the need for goods and the necessary volumes of purchases, drawing up orders for the supply of goods.
Depending on the time period, the following types of demand forecasts are distinguished:
- Operational (up to 1 month);
- opportunistic (from 3 to 6 months);
- Short-term (from 1 year to 2 years);
- Medium-term (from 2 to 5 years);
- Long-term (from 5 to 10 years);
- Promising (over 10 years).
Data collection
Demand forecasting is based on the collection of sales statistics. Moreover, this statistics should consist of a more or less homogeneous set of elements in terms of their volume and of a sufficient number of them.
For the B2C market, the volume of purchases per month is quite high - it can reach several thousand, and this volume will be enough for analysis. If we are talking about the B2B market, then the number of transactions per month should be at least 100 in order for the forecast to be as realistic as possible. It is also worth noting that for the purity of the forecast, it is necessary to exclude from the statistics large transactions that “stand out” from the total population, for example, about 10% of monthly revenue. If such transactions are not excluded, then they will create "outliers" in the dynamics, which will worsen the accuracy of the forecast.
Factors to consider when making a forecast:
- Volume and intensity of advertising,
- Sales promotion activities carried out
- Bringing new products to market,
- Opening of new sales directions,
- Customers with one-time significant purchases.
Forecasting methods
Demand forecasting is carried out by various methods, which are divided into:
- Sociological: forecasts based on surveys of end users in order to identify their opinions and intentions;
- Expert: forecasts, which are based on the selection and formation of a group of competent specialists in a given field in order to find out their opinion based on knowledge, experience, intuition, etc. The results of an expert survey are called an expert assessment. The main forms of such research are the Delphi method and the brainstorming method.
Economic and mathematical.
This type of forecast is considered the most objective, as it is based on the analysis of available data using mathematical formulas, graphs and models. Economic and mathematical forecasting includes such statistical methods as modeling (a predictive model that characterizes the dependence of one parameter on a number of factors), calculation of the demand elasticity coefficient, extrapolation (the forecast is based on past experience, which is then broadcast to the future).
Special methods.
Such methods involve, for example, the construction of a trend model 9 in graphical or mathematical form). A trend is a time factor that characterizes the main trend in indicators.
All forecasts, regardless of the method and method of their receipt, are optimistic and pessimistic.
Heuristic.
Such forecasts are subjective. There are two types:
Remark 1
Optimistic forecast- such a forecast, in which the best possible indicators for a given period prevail. The pessimistic forecast takes into account the lowest possible indicators of sales volumes and revenues. Such a run-up allows the company, firstly, to foresee possible options developments in the future, and secondly, gives it the opportunity and time to prepare a financial cushion in the event of an unfavorable market situation.


The meaning of the name diamond is sonan
Pirantel instructions for use for
What is a genetic passport What does a genetic passport include
Nebilet - a powerful tool in the fight against hypertension
Solution, aerosol Berodual: instructions for use for inhalation